How Long Till ETH Price Recovers as $428 Million Leaves ETFs?


Ethereum’s market sentiment continues to struggle following last Friday’s market crash, despite gradual signs of broader market improvement.
As institutional investors reduce participation, spot market participants have also trimmed their holdings. This could result in continued consolidation or a definitive breakdown of the critical $4,000 resistance level around which the coin currently trades.
Sponsored
Sponsored
Ethereum Market Hits Pause Amid Record ETF Redemptions
ETH-backed exchange-traded funds (ETFs) have recorded significant outflows since last Friday’s market-wide liquidation event. According to data from SosoValue, these funds registered $428.52 million in outflows on Monday.
For token TA and market updates: Want more token insights like this? Sign up for Editor Harsh Notariya’s Daily Crypto Newsletter here.
BlackRock’s iShares Ethereum Trust (ETHA) led ETF outflows with $310.13 million in redemptions, followed by Grayscale’s Ethereum Trust (ETHE) at $20.99 million and Fidelity’s Ethereum Fund (FETH) at $19.12 million.
Bitwise’s Ethereum ETF (ETHW) and VanEck’s Ethereum ETF (ETHV) recorded smaller declines of $12.18 million and $9.34 million, respectively, on the same day.
According to the data provider, Monday’s outflows marked the largest single-day capital exit from these funds since August 4, highlighting the decline in institutional interest following the liquidation event.
This trend may further dampen market sentiment around the altcoin and add more downward pressure on its price, limiting the coin’s ability to recover in the short term.
Sponsored
Sponsored
Bearish Signals Mount for Ethereum Amid Technical Weakness
Readings from the ETH/USD daily chart show the altcoin trading below its Super Trend indicator, which now acts as dynamic resistance at $4,561. For context, ETH is currently trading well below this level, at $3,986.
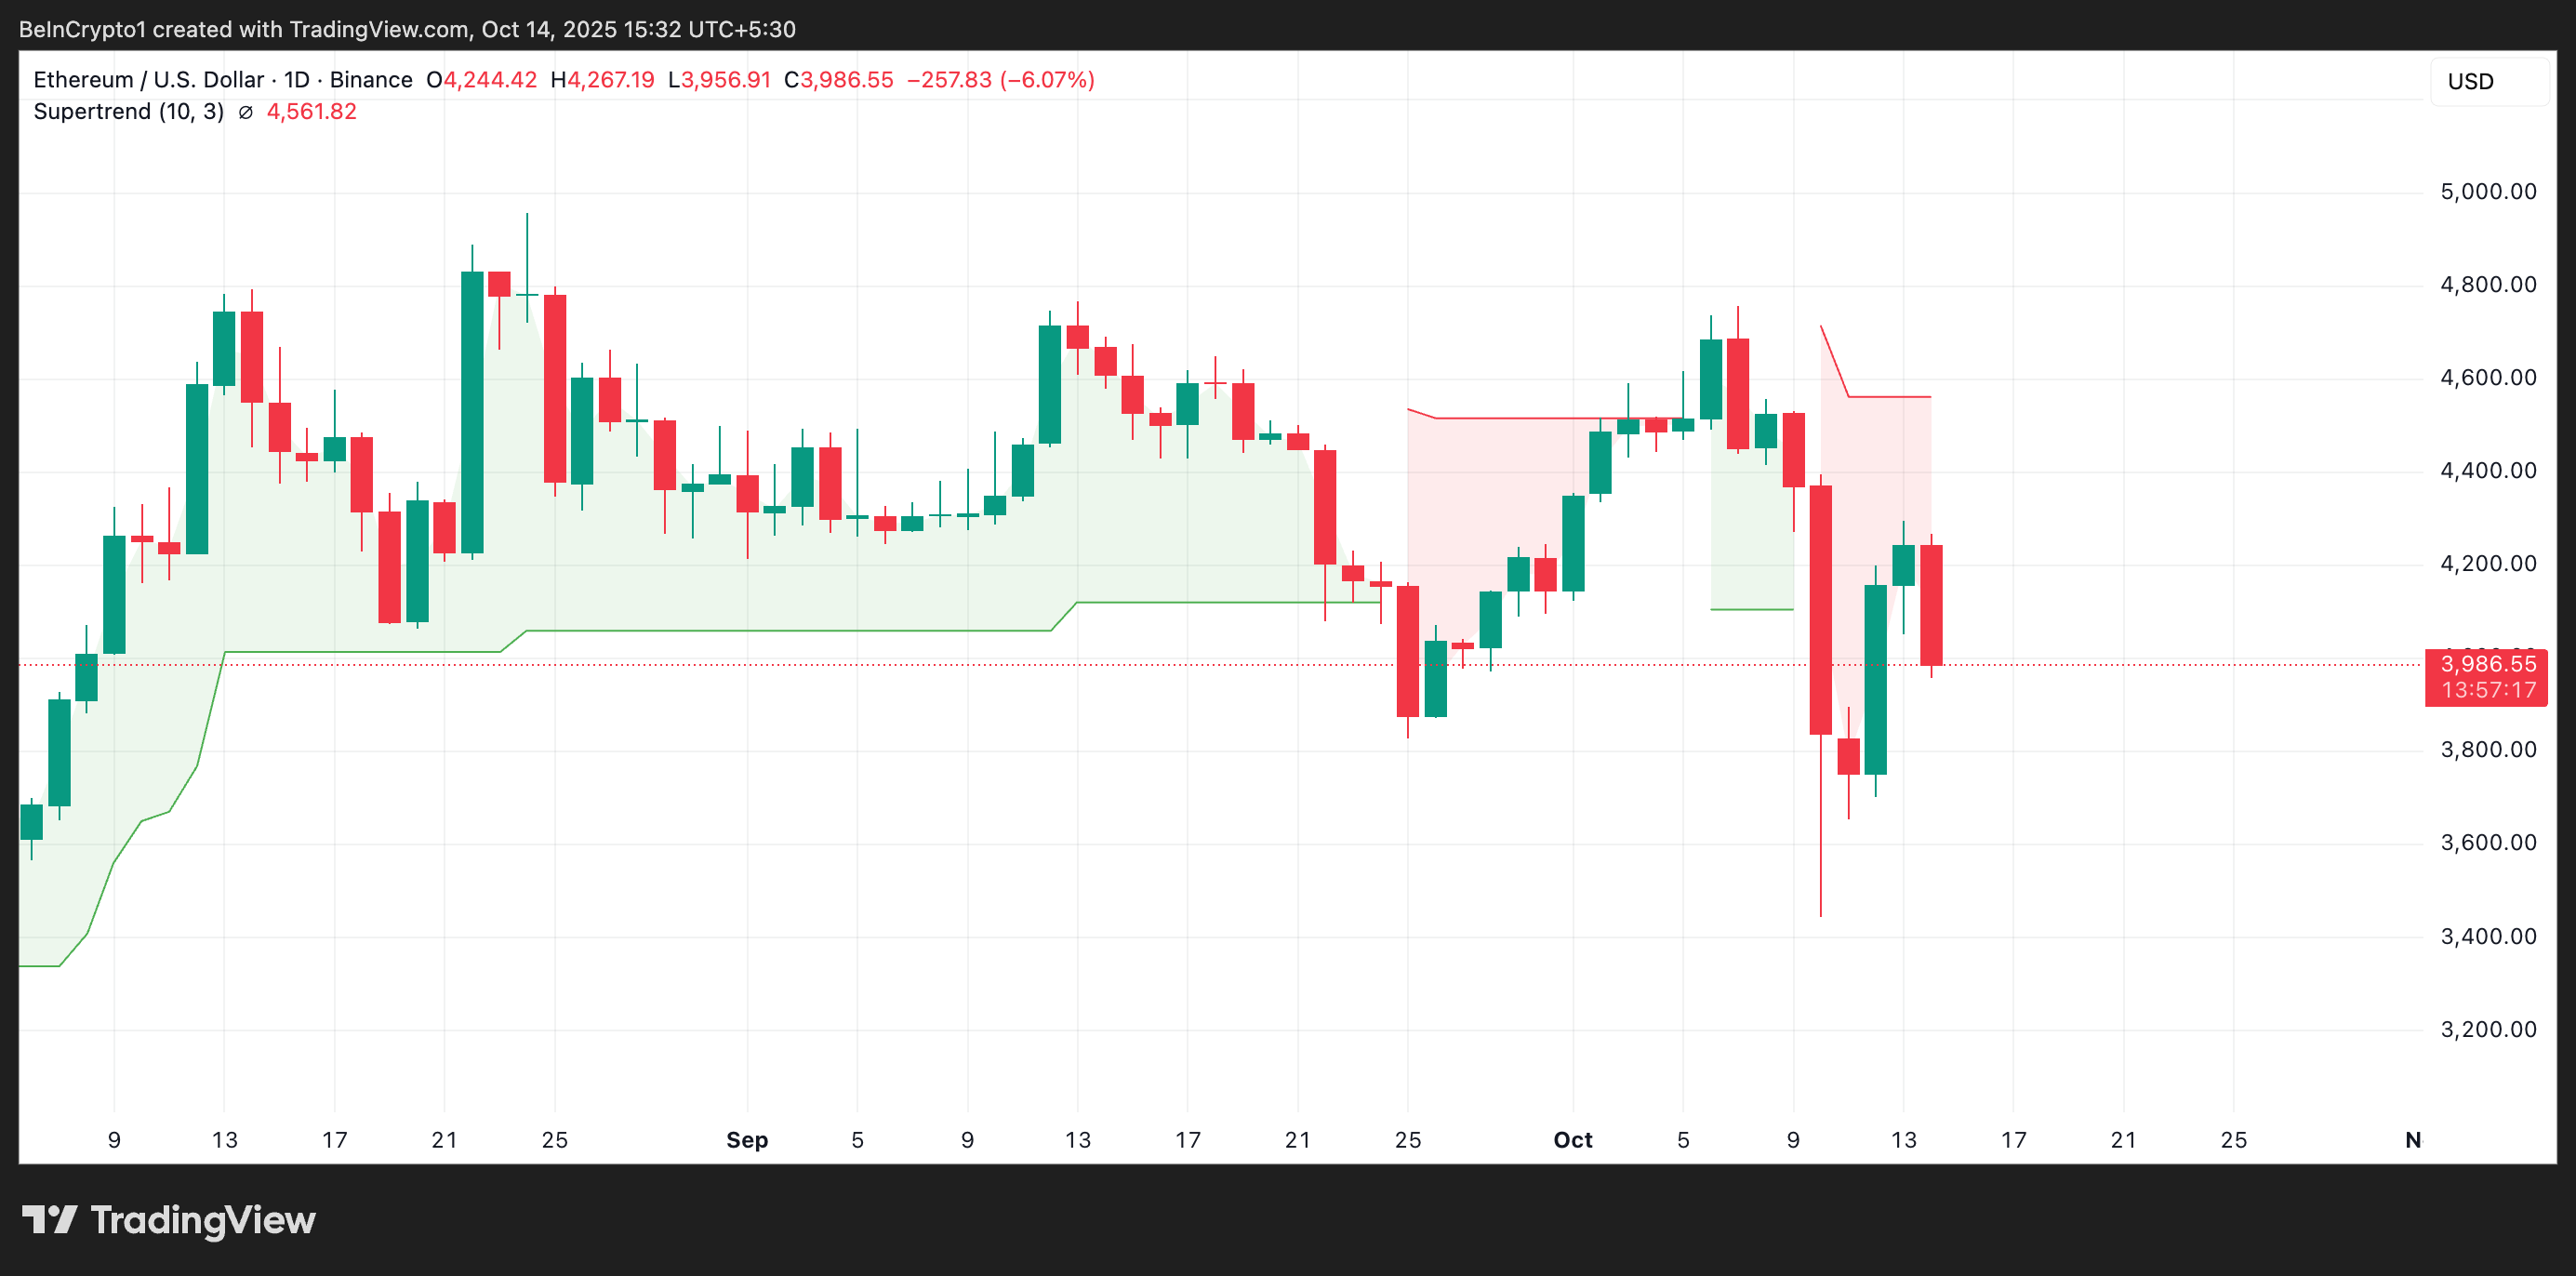
The Super Trend indicator helps traders identify the market’s direction by placing a line above or below the price chart based on the asset’s volatility.
When an asset’s price trades above the Super Trend line, it signals a bullish trend, indicating that the market is in an uptrend and buying pressure is dominant.
Conversely, as with ETH, when an asset trades below this line, it signals that the market is under bearish control. Traders usually interpret a position below the Super Trend as a warning that downward momentum could continue, making it harder for ETH to regain strength in the near term.
Bears Target Lower Levels While Buyers Wait
If bullish sentiment remains elusive, ETH could extend its decline below the critical $4,000 price level, potentially dropping to $3,626. If this level weakens, it could give way to a deeper decline toward $3,215.
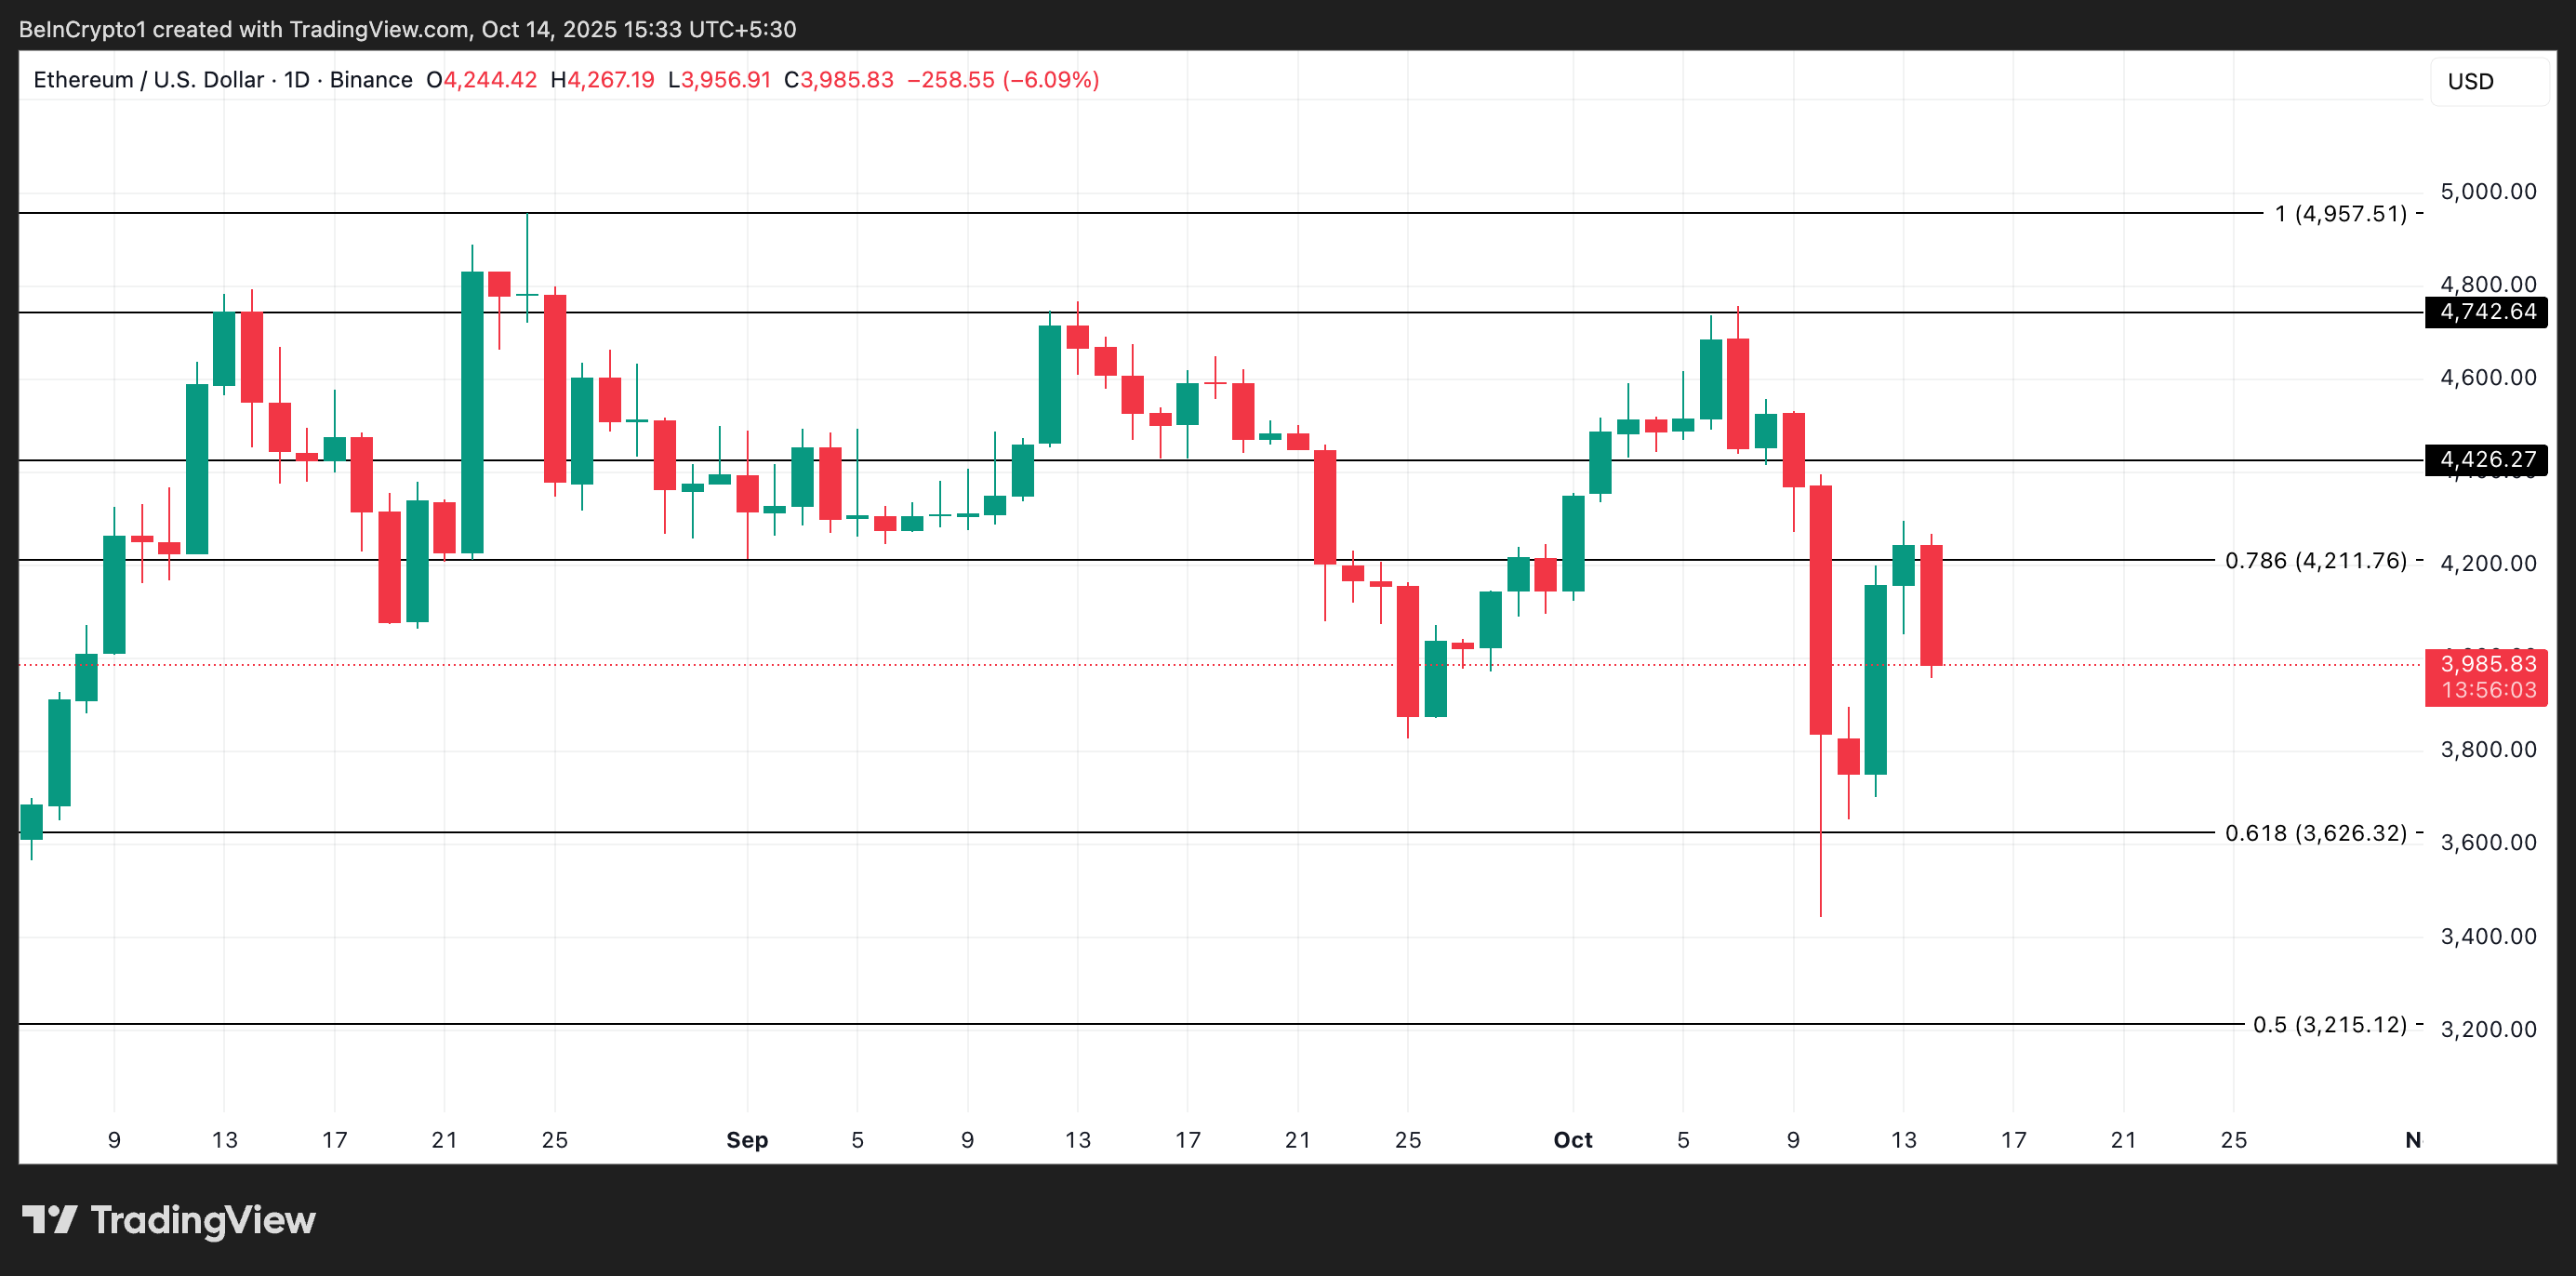
However, a rebound in new demand for the leading altcoin could invalidate this bearish outlook. In that scenario, the coin’s price could climb to $4,211.